Outlier detection and proper treatment is vital for obtaining reliable knowledge, and should be considered as a data pre-processing step during any modeling process.
What
An outlier is an observation that deviates so much from the other observations as to arouse suspicions that it was generated by a different mechanism.
Causes
Outliers occur very frequently in real data, and often go unnoticed because much data is processed by computers without careful inspection and screening. Some of the causes are:
Human error such as keypunch errors
Mechanical faults such as transmission or recording errors
Changes in system behavior
Exceptional events (natural disasters such as earthquakes e.t.c)
Instrument error
Through natural deviations in populations
Effects
The presence of outliers in a dataset may cause the parameter estimation to be erroneous, misclassifying the outcomes and consequently creating problems when making inferences with the wrong model.
Drawing unreliable conclusions and decisions
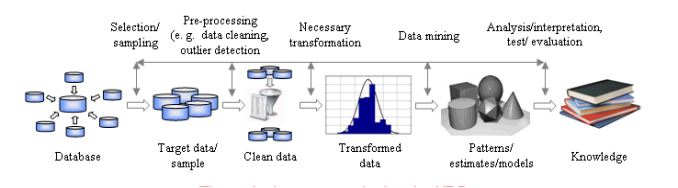
Knowledge Discovery
Knowledge discovery process
The important questions to ask with regards to knowledge discovery (building a machine learning model entails knowledge discovery):
What are the major factors that can make the discovery process unreliable?
How can we make sure that the discovered knowledge are reliable?
Under what conditions can a reliable discovery be assured?
What techniques are there that can improve the reliability of discovered knowledge?
When can we trust that the discovered knowledge is reliable and reflects the real data?
Log Odds (logit)
Log odds, also known as the logit, is a transformation of the probability of an event occurring, which allows us to model the relationship between the predictor variables and the probability of the event. The log odds is defined as the natural logarithm of the odds of the event occurring, where the odds is the ratio of the probability of the event occurring to the probability of the event not occurring
log odds = log(p / (1-p) ) where p is the probability of the event occurring.
Logit can take any value between negative infinity and positive infinity. In logistic regression, we use the log odds as the response variable and model it as a linear function of the predictor variables. The coefficients of the predictor variables in the linear model represents the change in the log odds for a one unit increase in the corresponding predictor variable.
We can then exponentiate these coefficients to obtain the odds ratio, which represents the multiplicative change in the odds of the event occurring for a one unit increase in the corresponding predictor variable.
The odds ratio is defined as the ratio of the probability of the event occurring to the probability of the event not occurring. For example, if the probability of a patient surviving a medical procedure is 0.8, then the odds of survival are 0.8/0.8 = 4, and the log odds are log(4) = 1.386
In logistic regression, we use the log odds as the response variable and model it as a linear function of the predictor variables. The logistic regression model can be extended to include more complex relationships between the predictor variables and the log odds, such as interactions between the predictor variables or non-linear relationships. These extensions can be useful for modeling more complex phenomenon in a wide range of fields, including economics, social sciences, biology, and engineering.
Logistic Regression and the Outlier
The customary model for logistic regression is
E(Y | X ) = π(X )
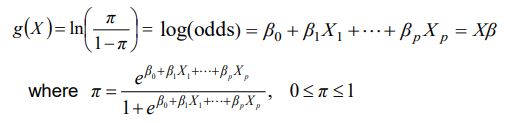
The log of [π (.)/(1-π (.))] can be defined as a linear function called logit (log odds) of X
The logistic regression can be re-written as
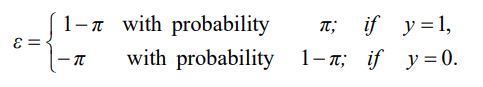
Y = π + ε
where Y is a vector of binary (0, 1) response and ε is the error term:
Types of Outliers
Deviation/change in X (explanatory) space, called leverage points
Deviation in Y (response variable) not in X, called vertical outliers
Deviation in both (X-Y) spaces
Influential Observations
Are defined as points, which either Individually or together with several other observations, have a demonstrably larger impact on the calculated values of various estimates (coefficients, standard errors, t-values etc.).
In logistic regression, outliers and influential observations may occur as misclassification between the binary (0, 1) responses. It may occur by meaningful deviation (we also see low leverage) in explanatory variables.
Handling Outliers
Detection -
Use either box plots, scatter plots, or leverage plots to identify the outliers.
Use statistical tests to determine whether an observation is an outlier or not
Z-Score
IQR
Handling Outliers - There are so many techniques and recommendations (more than ten) and their use depends on specific use case and objective of the modeling.
Removal - Caution must be taken when doing this to avoid introducing bias as a result of removing so many data points
Data Transformation - this is in order to reduce the impact of outliers and to help make the data more normally distributed and thus improving the model's performance
Logarithmic transformations
Square Root Transformations
Use of Robust regression methods which are less sensitive to outliers than ordinary least squares (OLS) regression. Robust regression methods are particularly useful in fields such as finance, where outliers can have a significant impact on the results, or in experimental science, where outliers may be due to measurement errors or other sources of variability. Examples are:
M-estimation - This method involves minimizing a robust loss function, such as Huber Loss function or the Tukey Biweight loss function, which downweights the influence of outliers. The estimates of the regression parameters obtained using M-estimation are less sensitive to outliers than the estimates obtained using OLS
Least Trimmed Squares (LTS) - This method involves fitting the model to a subset of the data that contains the least number of outliers. It is computationally intensive, but it can be very effective in reducing the influence of outliers.
Weighted Least Squares (WLS) - This method involves assigning weights to the observations based on their influence on the regression estimates. The weights are typically inversely proportional to the variance of the residuals, so that observations with large residuals are downweighted.
Robust principle component regression - This method involves first applying principal component analysis (PCA) to the data to reduce its dimensionality, and then applying M-estimation to the reduced data.
Use of Regularization which penalize large coefficients which can reduce the impact of outliers on the model's performance.
L1 regularization
L2 regularization
Use Decision Trees which can handle outliers by partitioning the data into subsets based on the predictor variables. Decision trees can handle outliers because they are not affected by the distribution of the response variable. However, decision trees can be prone to overfitting, so it is important to use regularization techniques to control for overfitting.
Use Ensemble methods - which can handle outliers by combining multiple models to make predictions. Ensemble methods are less sensitive to outliers than individual models because they are less affected by the noise in the data. However, ensemble methods can be computationally expensive and may require tuning of hyperparameters.
Random Forest
Gradient Boosting
Practical Notebooks
Students enrolling for any AI related course from Carnegie Training Institute have access to jupyter notebook, class exercises illustrating this reasoning.


 The logistic regression can be re-written as