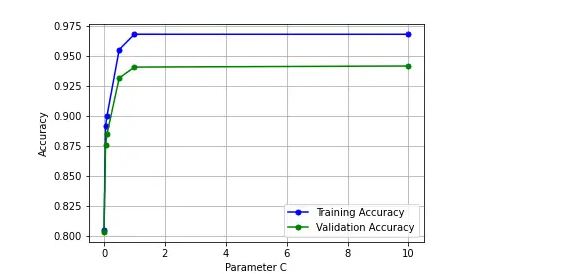


It is sometimes helpful to plot the influence of a single hyperparameter on the training score and the validation score to find out whether the estimator is overfitting or underfitting for some hyperparameter values. The function validation_curve can help in this case.

To validate a model we need a scoring function, for example accuracy for classifiers. The proper way of choosing multiple hyperparameters of an estimator is of course grid search or similar methods that select the hyperparameter with the maximum score on a validation set or multiple validation sets.
Note that if we optimize the hyperparameters based on a validation score the validation score is biased and not a good estimate of the generalization any longer. To get a proper estimate of the generalization we have to compute the score on another test set.
As like learning curve, the validation curve also helps in diagnozing the model bias vs variance. The validation curve plot helps in selecting most appropriate model parameters (hyper-parameters).
Unlike learning curve, the validation curves helps in assessing the model bias-variance issue (underfitting vs overfitting problem) against the model parameters.
Validation curve represents model scores (accuracy) for training and test data against the alpha parameter of Ridge. For that purpose, it takes two specific input parameters such as param_name (alpha and param_range (different values of alpha)
A validation curve is typically drawn between some parameter of the model and the model’s score. Two curves are present in a validation curve – one for the training set score and one for the cross-validation score. By default, the function for validation curve, present in the scikit-learn library performs 3-fold cross-validation.
Interpreting Validation Curves
Sources